In the era of high-speed networks and cloud-native infrastructure, real-time, efficient network traffic monitoring has become a cornerstone of reliable IT operations. As networks scale to support 10 Gbps+ links, containerized applications, and distributed architectures, traditional traffic monitoring methods—such as full packet capture—are no longer feasible due to their high resource overhead. This is where sFlow (sampled Flow) comes into play: a lightweight, standardized network telemetry protocol designed to provide comprehensive visibility into network traffic without crippling network devices. In this blog, we’ll answer the most critical questions about sFlow, from its basic definition to its practical operation in Network Packet Brokers (NPBs).
1. What is sFlow?
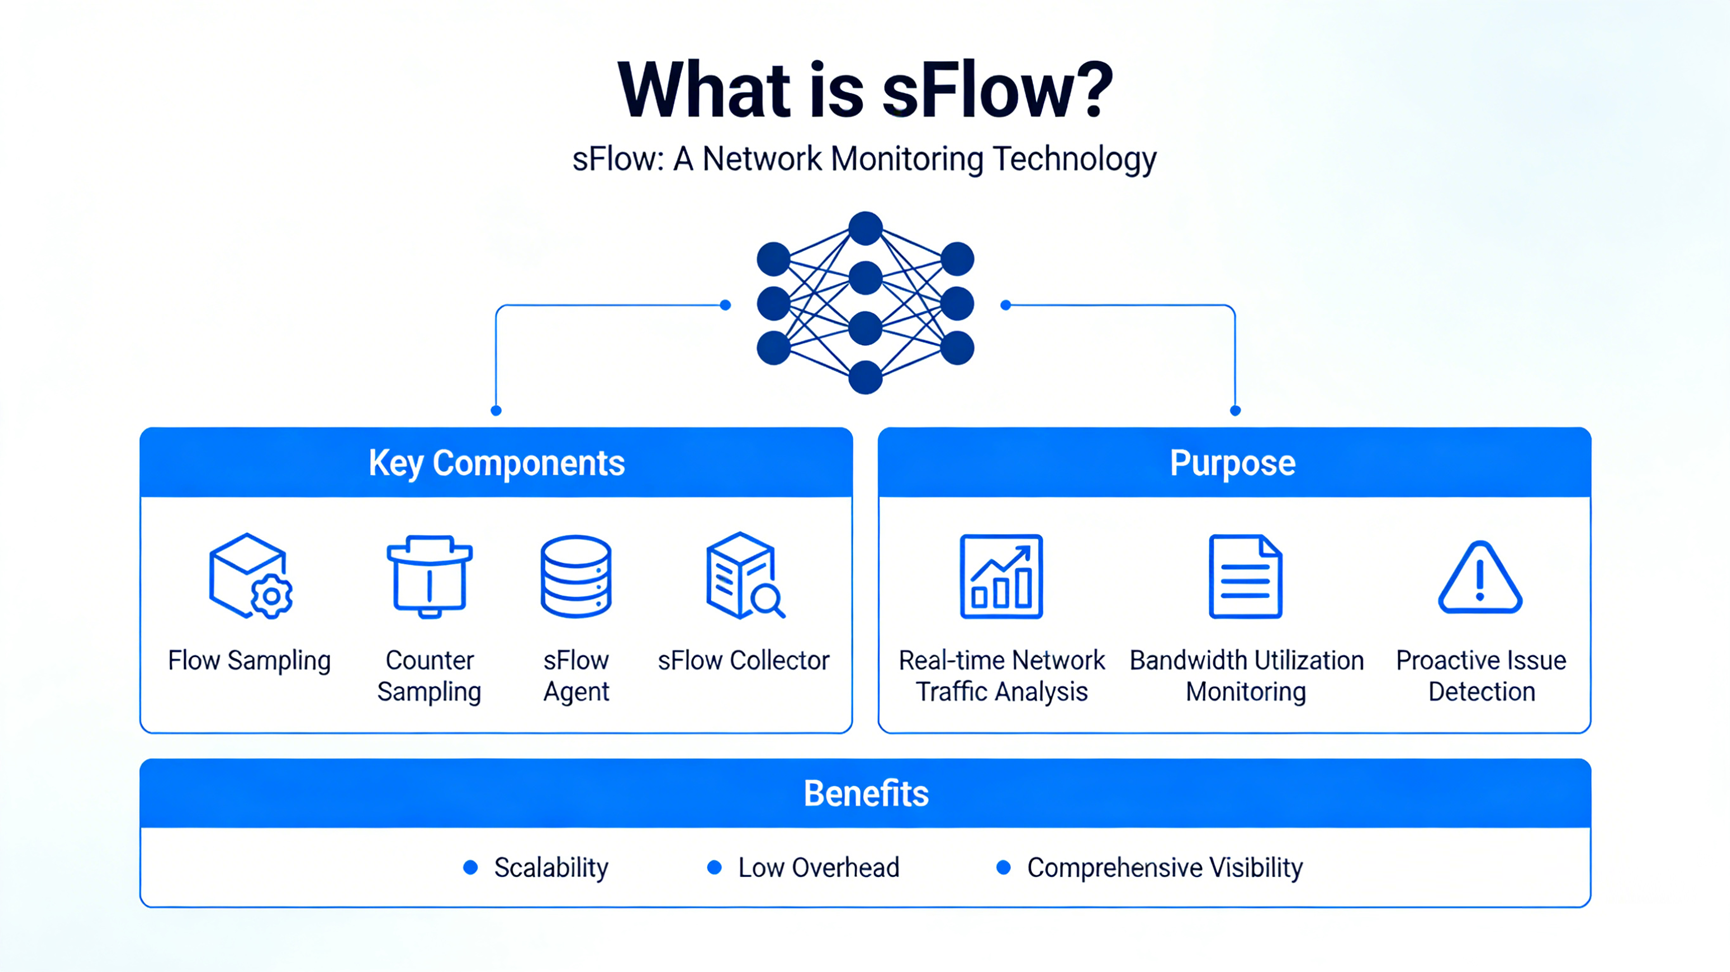
sFlow is an open, industry-standard network traffic monitoring protocol developed by Inmon Corporation, defined in RFC 3176. Contrary to what its name might suggest, sFlow has no inherent “flow tracking” logic—it is a sampling-based telemetry technology that collects and exports network traffic statistics to a central collector for analysis. Unlike stateful protocols like NetFlow, sFlow does not store flow records on network devices; instead, it captures small, representative samples of traffic and device counters, then promptly forwards this data to a collector for processing.
At its core, sFlow is designed for scalability and low resource consumption. It is embedded in network devices (switches, routers, firewalls) as an sFlow Agent, enabling real-time monitoring of high-speed links (up to 10 Gbps and beyond) without degrading device performance or network throughput. Its standardization ensures compatibility across vendors, making it a universal choice for heterogeneous network environments.
2. How Does sFlow Work?
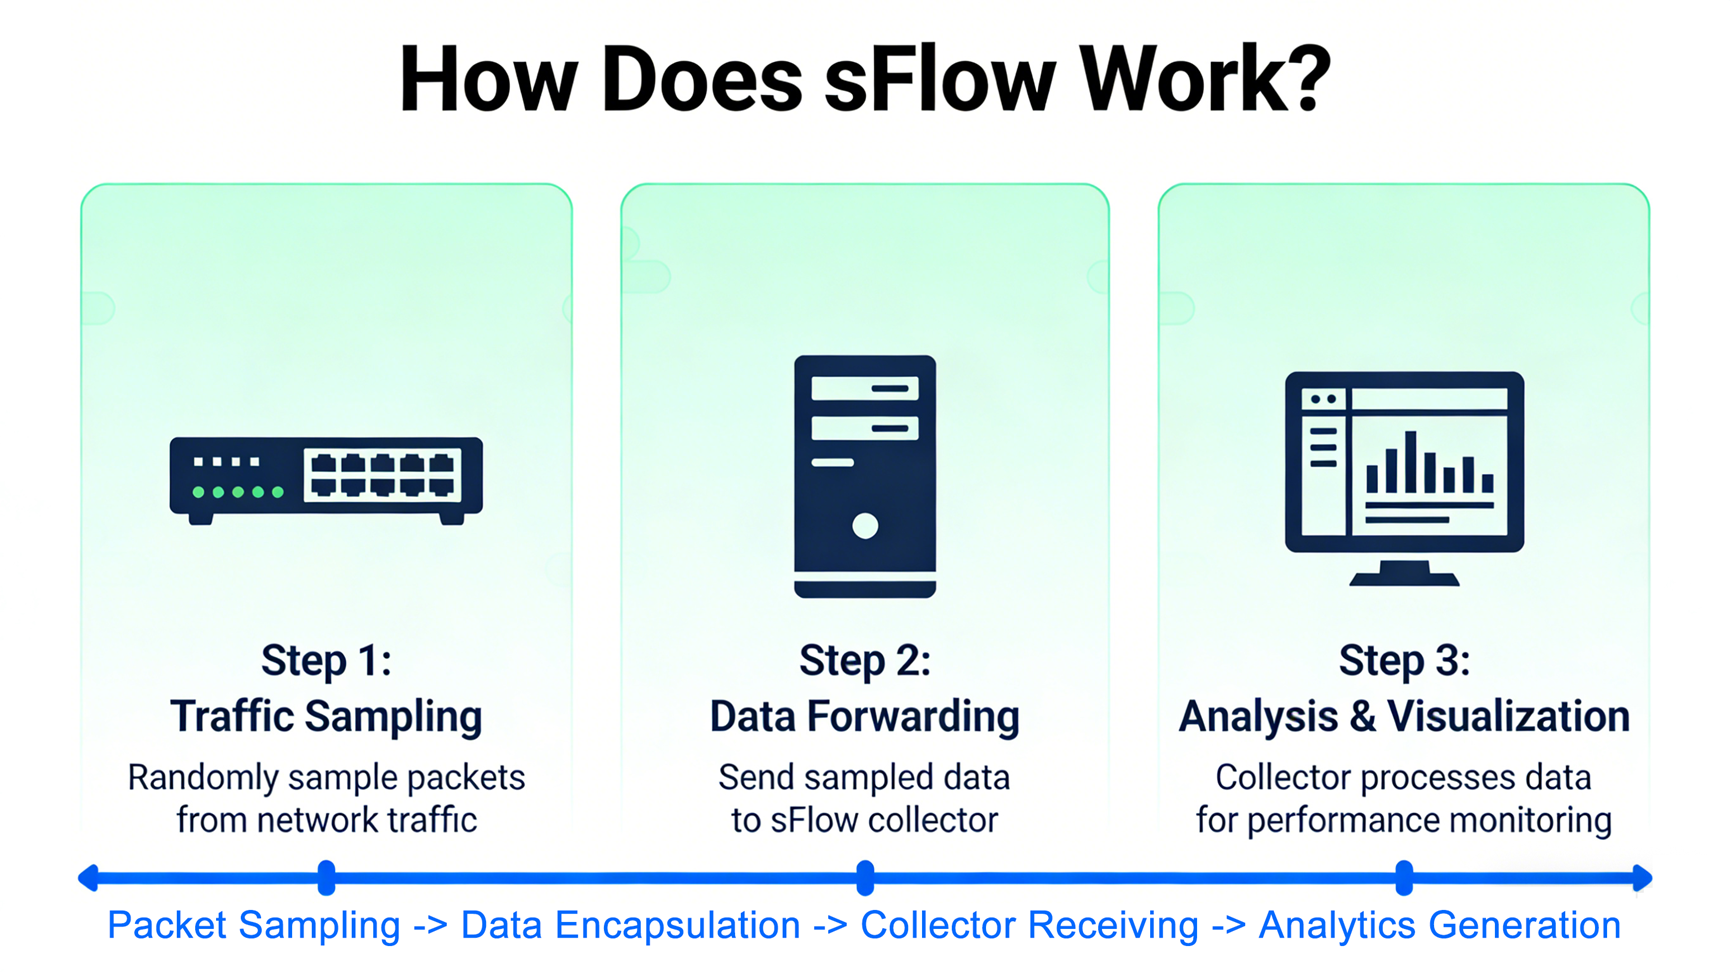
sFlow operates on a simple, two-component architecture: sFlow Agent (embedded in network devices) and sFlow Collector (a centralized server for data aggregation and analysis). The workflow revolves around two key sampling mechanisms—packet sampling and counter sampling—and data export, as detailed below:
2.1 Core Components
- sFlow Agent: A lightweight software module built into network devices (e.g., Cisco switches, Huawei routers). It is responsible for collecting traffic samples and counter data, encapsulating this data into sFlow Datagrams, and sending them to the collector via UDP (default port 6343).
- sFlow Collector: A centralized system (physical or virtual) that receives, parses, stores, and analyzes sFlow Datagrams. Unlike NetFlow collectors, sFlow collectors must handle raw packet headers (typically 60–140 bytes per sample) and parse them to extract meaningful insights—this flexibility allows support for non-standard packets like MPLS, VXLAN, and GRE.
2.2 Key Sampling Mechanisms
sFlow uses two complementary sampling methods to balance visibility and resource efficiency:
1- Packet Sampling: The Agent randomly samples incoming/outgoing packets on monitored interfaces. For example, a sampling rate of 1:2048 means the Agent captures 1 out of every 2048 packets (the default sampling rate for most devices). Instead of capturing entire packets, it collects only the first few bytes of the packet header (typically 60–140 bytes), which contains critical information (source/destination IP, port, protocol) while minimizing overhead. The sampling rate is configurable and should be adjusted based on network traffic volume—higher rates (more samples) improve accuracy but increase resource usage, while lower rates reduce overhead but may miss rare traffic patterns.
2- Counter Sampling: In addition to packet samples, the Agent periodically collects counter data from network interfaces (e.g., bytes transmitted/received, packet drops, error rates) at fixed intervals (default: 10 seconds). This data provides context about device and link health, complementing packet samples to deliver a complete picture of network performance.
2.3 Data Export and Analysis
Once collected, the Agent encapsulates packet samples and counter data into sFlow Datagrams (UDP packets) and sends them to the collector. The collector parses these datagrams, aggregates the data, and generates visualizations, reports, or alerts. For example, it can identify top talkers, detect abnormal traffic patterns (e.g., DDoS attacks), or track bandwidth utilization over time. The sampling rate is included in each datagram, allowing the collector to extrapolate the data to estimate total traffic volume (e.g., 1 sample out of 2048 implies ~2048x the observed traffic).
3. What’s the Core Value of sFlow?
sFlow’s value stems from its unique combination of scalability, low overhead, and standardization—addressing the key pain points of modern network monitoring. Its core value propositions are:
3.1 Low Resource Overhead
Unlike full packet capture (which requires storing and processing every packet) or stateful protocols like NetFlow (which maintains flow tables on devices), sFlow uses sampling and avoids local data storage. This minimizes CPU, memory, and bandwidth usage on network devices, making it ideal for high-speed links and resource-constrained environments (e.g., small-to-medium enterprise networks). It requires no additional hardware or memory upgrades for most devices, reducing deployment costs.
3.2 High Scalability
sFlow is designed to scale with modern networks. A single collector can monitor tens of thousands of interfaces across hundreds of devices, supporting links up to 100 Gbps and beyond. Its sampling mechanism ensures that even as traffic volume increases, the Agent’s resource usage remains manageable—critical for data centers and carrier-grade networks with massive traffic loads.
3.3 Comprehensive Network Visibility
By combining packet sampling (for traffic content) and counter sampling (for device/link health), sFlow provides end-to-end visibility into network traffic. It supports Layer 2 to Layer 7 traffic, enabling monitoring of applications (e.g., web, P2P, DNS), protocols (e.g., TCP, UDP, MPLS), and user behavior. This visibility helps IT teams detect bottlenecks, troubleshoot issues, and optimize network performance proactively.
3.4 Vendor-Neutral Standardization
As an open standard (RFC 3176), sFlow is supported by all major network vendors (Cisco, Huawei, Juniper, Arista) and integrates with popular monitoring tools (e.g., PRTG, SolarWinds, sFlow-RT). This eliminates vendor lock-in and allows organizations to use sFlow across heterogeneous network environments (e.g., mixed Cisco and Huawei devices).
4. Typical Application Scenarios of sFlow
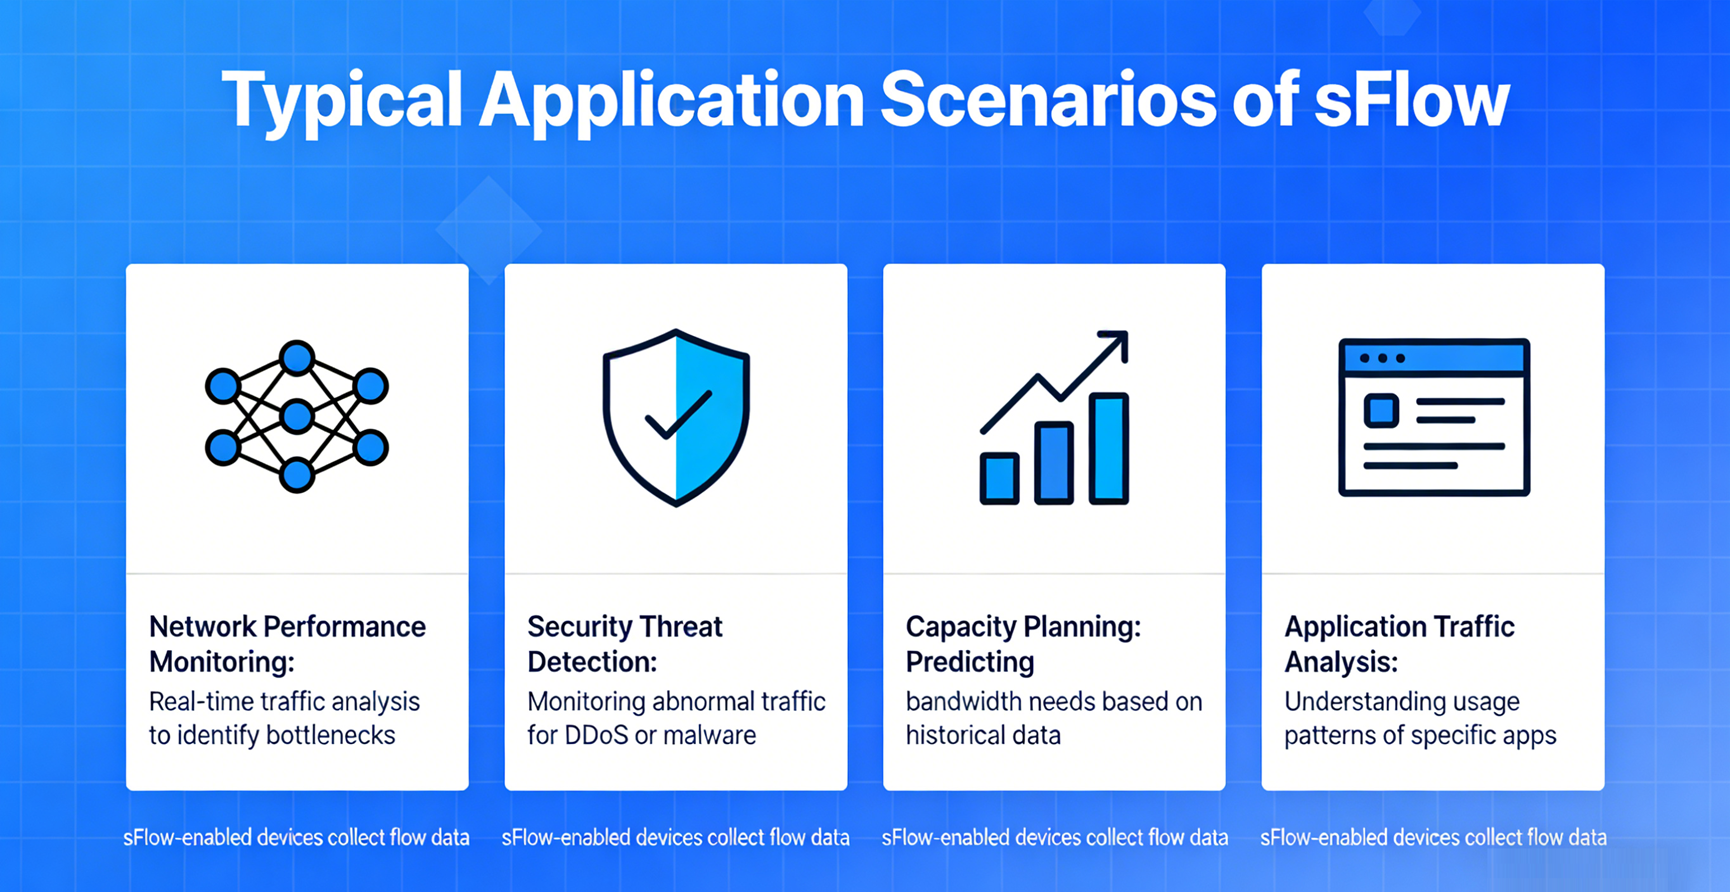
sFlow’s versatility makes it suitable for a wide range of network environments, from small enterprises to large data centers. Its most common application scenarios include:
4.1 Data Center Network Monitoring
Data centers rely on high-speed links (10 Gbps+) and support thousands of virtual machines (VMs) and containerized applications. sFlow provides real-time visibility into leaf-spine network traffic, helping IT teams detect “elephant flows” (large, long-lived flows that cause congestion), optimize bandwidth allocation, and troubleshoot inter-VM/container communication issues. It is often used with SDN (Software-Defined Networking) to enable dynamic traffic engineering.
4.2 Enterprise Campus Network Management
Enterprise campuses require cost-effective, scalable monitoring to track employee traffic, enforce bandwidth policies, and detect anomalies (e.g., unauthorized devices, P2P file sharing). sFlow’s low overhead makes it ideal for campus switches and routers, enabling IT teams to identify bandwidth hogs, optimize application performance (e.g., Microsoft 365, Zoom), and ensure reliable connectivity for end-users.
4.3 Carrier-Grade Network Operations
Telecom operators use sFlow to monitor backbone and access networks, tracking traffic volume, latency, and error rates across thousands of interfaces. It helps operators optimize peering relationships, detect DDoS attacks early, and bill customers based on bandwidth usage (usage accounting).
4.4 Network Security Monitoring
sFlow is a valuable tool for security teams, as it can detect abnormal traffic patterns associated with DDoS attacks, port scans, or malware. By analyzing packet samples, collectors can identify unusual source/destination IP pairs, unexpected protocol usage, or sudden spikes in traffic—triggering alerts for further investigation. Its support for raw packet headers makes it particularly effective for detecting non-standard attack vectors (e.g., encrypted DDoS traffic).
4.5 Capacity Planning and Trend Analysis
By collecting historical traffic data, sFlow enables IT teams to identify trends (e.g., seasonal bandwidth spikes, growing application usage) and plan network upgrades proactively. For example, if sFlow data shows that bandwidth usage increases by 20% annually, teams can budget for additional links or device upgrades before congestion occurs.
5. Limitations of sFlow
While sFlow is a powerful monitoring tool, it has inherent limitations that organizations must consider when deploying it:
5.1 Sampling Accuracy Trade-Off
sFlow’s biggest limitation is its reliance on sampling. Low sampling rates (e.g., 1:10000) may miss rare but critical traffic patterns (e.g., short-lived attack flows), while high sampling rates increase resource overhead. Additionally, sampling introduces statistical variance—estimates of total traffic volume may not be 100% accurate, which can be problematic for use cases requiring precise traffic counting (e.g., billing for mission-critical services).
5.2 No Full Flow Context
Unlike NetFlow (which captures complete flow records, including start/end times and total bytes/packets per flow), sFlow only captures individual packet samples. This makes it difficult to track the full lifecycle of a flow (e.g., identifying when a flow started, how long it lasted, or its total bandwidth consumption).
5.3 Limited Support for Certain Interfaces/ Modes
Many network devices only support sFlow on physical interfaces—virtual interfaces (e.g., VLAN subinterfaces, port channels) or stack modes may not be supported. For example, Cisco switches do not support sFlow when booted in stack mode, limiting its use in stacked switch deployments.
5.4 Dependence on Agent Implementation
sFlow’s effectiveness depends on the quality of the Agent implementation on network devices. Some low-end devices or older hardware may have poorly optimized Agents that either consume excessive resources or provide inaccurate samples. For example, some routers have slow control plane CPUs that prevent setting optimal sampling rates, reducing detection accuracy for attacks like DDoS.
5.5 Limited Encrypted Traffic Insight
sFlow only captures packet headers—encrypted traffic (e.g., TLS 1.3) hides payload data, making it impossible to identify the actual application or content of the flow. While sFlow can still track basic metrics (e.g., source/destination, packet size), it cannot provide deep visibility into encrypted traffic behavior (e.g., malicious payloads hidden in HTTPS traffic).
5.6 Collector Complexity
Unlike NetFlow (which provides pre-parsed flow records), sFlow requires collectors to parse raw packet headers. This increases the complexity of collector deployment and management, as teams must ensure the collector can handle different packet types and protocols (e.g., MPLS, VXLAN).
6. How Does sFlow Work in Network Packet Broker (NPB)?
A Network Packet Broker (NPB) is a specialized device that aggregates, filters, and distributes network traffic to monitoring tools (e.g., sFlow collectors, IDS/IPS, full packet capture systems). NPBs act as “traffic hubs,” ensuring that monitoring tools receive only the relevant traffic they need—improving efficiency and reducing tool overload. When integrated with sFlow, NPBs enhance sFlow’s capabilities by addressing its limitations and extending its visibility.
6.1 NPB’s Role in sFlow Deployments
In traditional sFlow deployments, each network device (switch, router) runs an sFlow Agent that sends samples directly to the collector. This can lead to collector overload in large networks (e.g., thousands of devices sending UDP datagrams simultaneously) and makes it difficult to filter irrelevant traffic. NPBs solve this by acting as a centralized sFlow Agent or traffic aggregator, as follows:
6.2 Key Integration Modes
1- Centralized sFlow Sampling: The NPB aggregates traffic from multiple network devices (via SPAN/RSPAN ports or TAPs), then runs an sFlow Agent to sample this aggregated traffic. Instead of each device sending samples to the collector, the NPB sends a single stream of samples—reducing collector load and simplifying management. This mode is ideal for large networks, as it centralizes sampling and ensures consistent sampling rates across the network.
2- Traffic Filtering and Optimization: NPBs can filter traffic before sampling, ensuring that only relevant traffic (e.g., traffic from critical subnets, specific applications) is sampled by the sFlow Agent. This reduces the number of samples sent to the collector, improving efficiency and reducing storage requirements. For example, an NPB can filter out internal management traffic (e.g., SSH, SNMP) that does not require monitoring, focusing sFlow on user and application traffic.
3- Sample Aggregation and Correlation: NPBs can aggregate sFlow samples from multiple devices, then correlate this data (e.g., linking traffic from a source IP to multiple destinations) before sending it to the collector. This provides the collector with a more complete view of network flows, addressing sFlow’s limitation of not tracking full flow contexts. Some advanced NPBs also support adjusting sampling rates dynamically based on traffic volume (e.g., increasing sampling rates during traffic spikes to improve accuracy).
4- Redundancy and High Availability: NPBs can provide redundant paths for sFlow samples, ensuring that no data is lost if a collector fails. They can also load-balance samples across multiple collectors, preventing any single collector from becoming a bottleneck.
6.3 Practical Benefits of NPB + sFlow Integration
Integrating sFlow with an NPB delivers several key benefits:
- Scalability: NPBs handle traffic aggregation and sampling, allowing the sFlow collector to scale to support thousands of devices without overload.
- Accuracy: Dynamic sampling rate adjustment and traffic filtering improve the accuracy of sFlow data, reducing the risk of missing critical traffic patterns.
- Efficiency: Centralized sampling and filtering reduce the number of samples sent to the collector, lowering bandwidth and storage usage.
- Simplified Management: NPBs centralize sFlow configuration and monitoring, eliminating the need to configure Agents on every network device.
Conclusion
sFlow is a lightweight, scalable, and standardized network monitoring protocol that addresses the unique challenges of modern high-speed networks. By using sampling to collect traffic and counter data, it provides comprehensive visibility without degrading device performance—making it ideal for data centers, enterprises, and carriers. While it has limitations (e.g., sampling accuracy, limited flow context), these can be mitigated by integrating sFlow with a Network Packet Broker, which centralizes sampling, filters traffic, and enhances scalability.
Whether you’re monitoring a small campus network or a large carrier backbone, sFlow offers a cost-effective, vendor-neutral solution to gain actionable insights into network performance. When paired with an NPB, it becomes even more powerful—enabling organizations to scale their monitoring infrastructure and maintain visibility as their networks grow.
Post time: Feb-05-2026


